Here’s a handy infographic, courtesy of The Wrap, that gives a visual perspective to the American Idol ratings trajectory over the years.
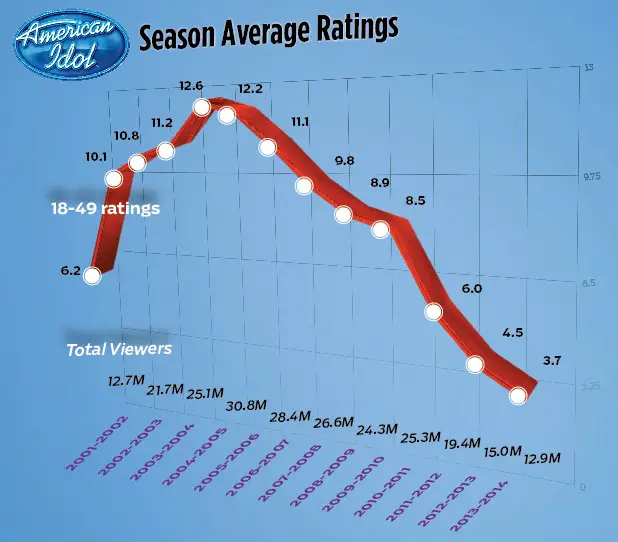
As you can see, the apex of Idol ratings was Season 5. It dips a bit in Season 6, but then begins larger drops at Season 7. The drop between 9 and 10 narrows, but then drop precipitously at Season 11. The drops are smaller between 11, 12 and 13.
ETA: The Voice debuted on April 26, 2011. The X Factor premiered the following September. I don’t think it’s a coincidence that there was a huge drop for Season 11 when it debuted in January, 2012.
Check out more at The Wrap.